Sensors
MOS supports hardware and system sensors that can be displayed on the Dashboard. Sensors allow you to monitor values such as temperatures, voltages, fan speeds, or custom metrics collected from the system.
This page explains how to view, configure, and display sensors in MOS.
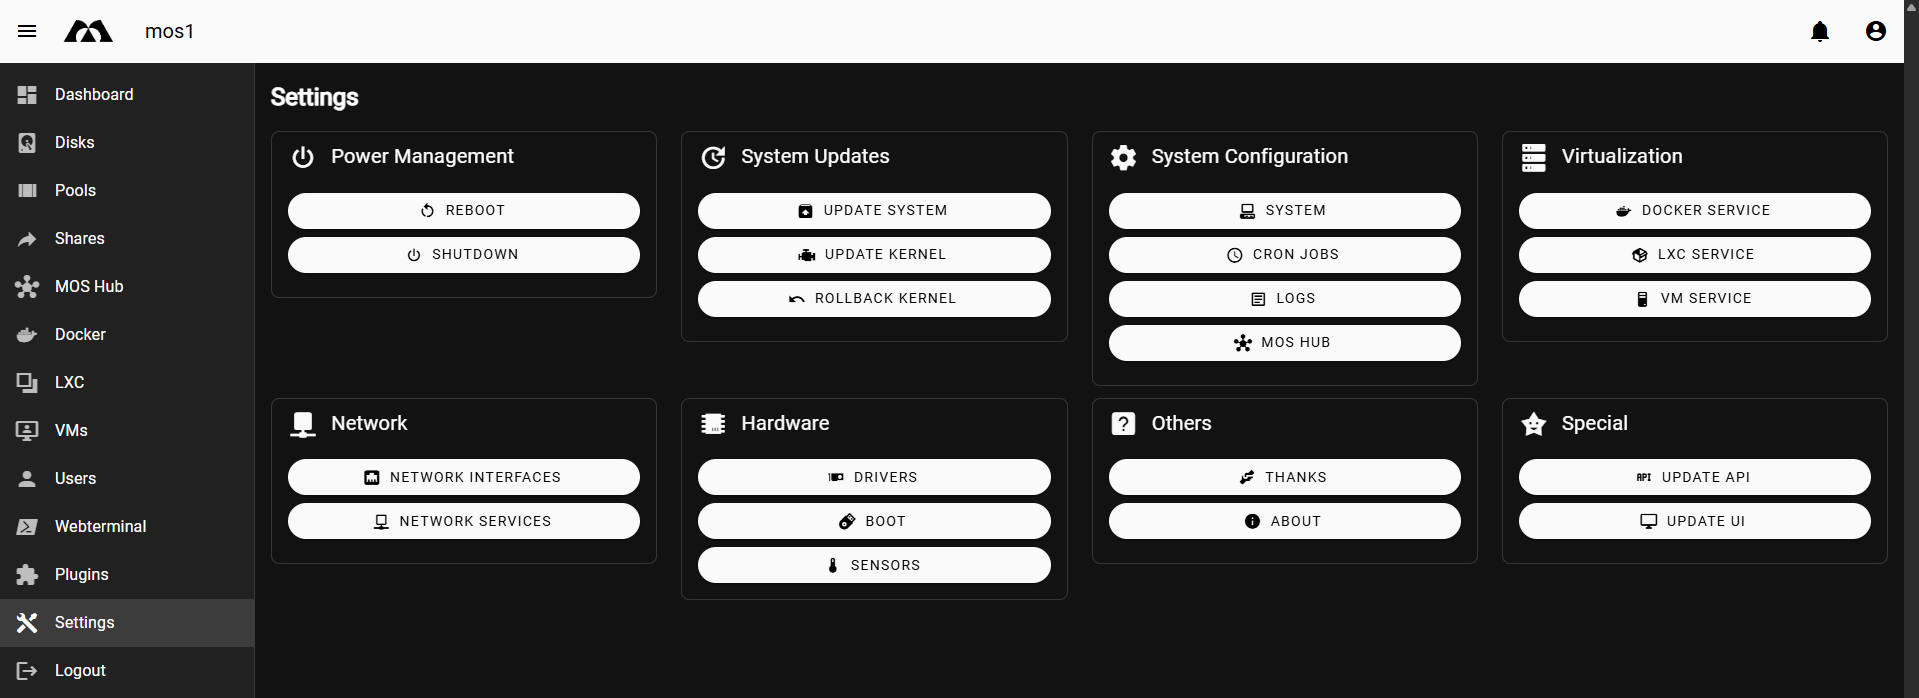
📍 Accessing Sensors
Navigate to:
Settings → Hardware → Sensors
This view shows all detected and configured sensors.
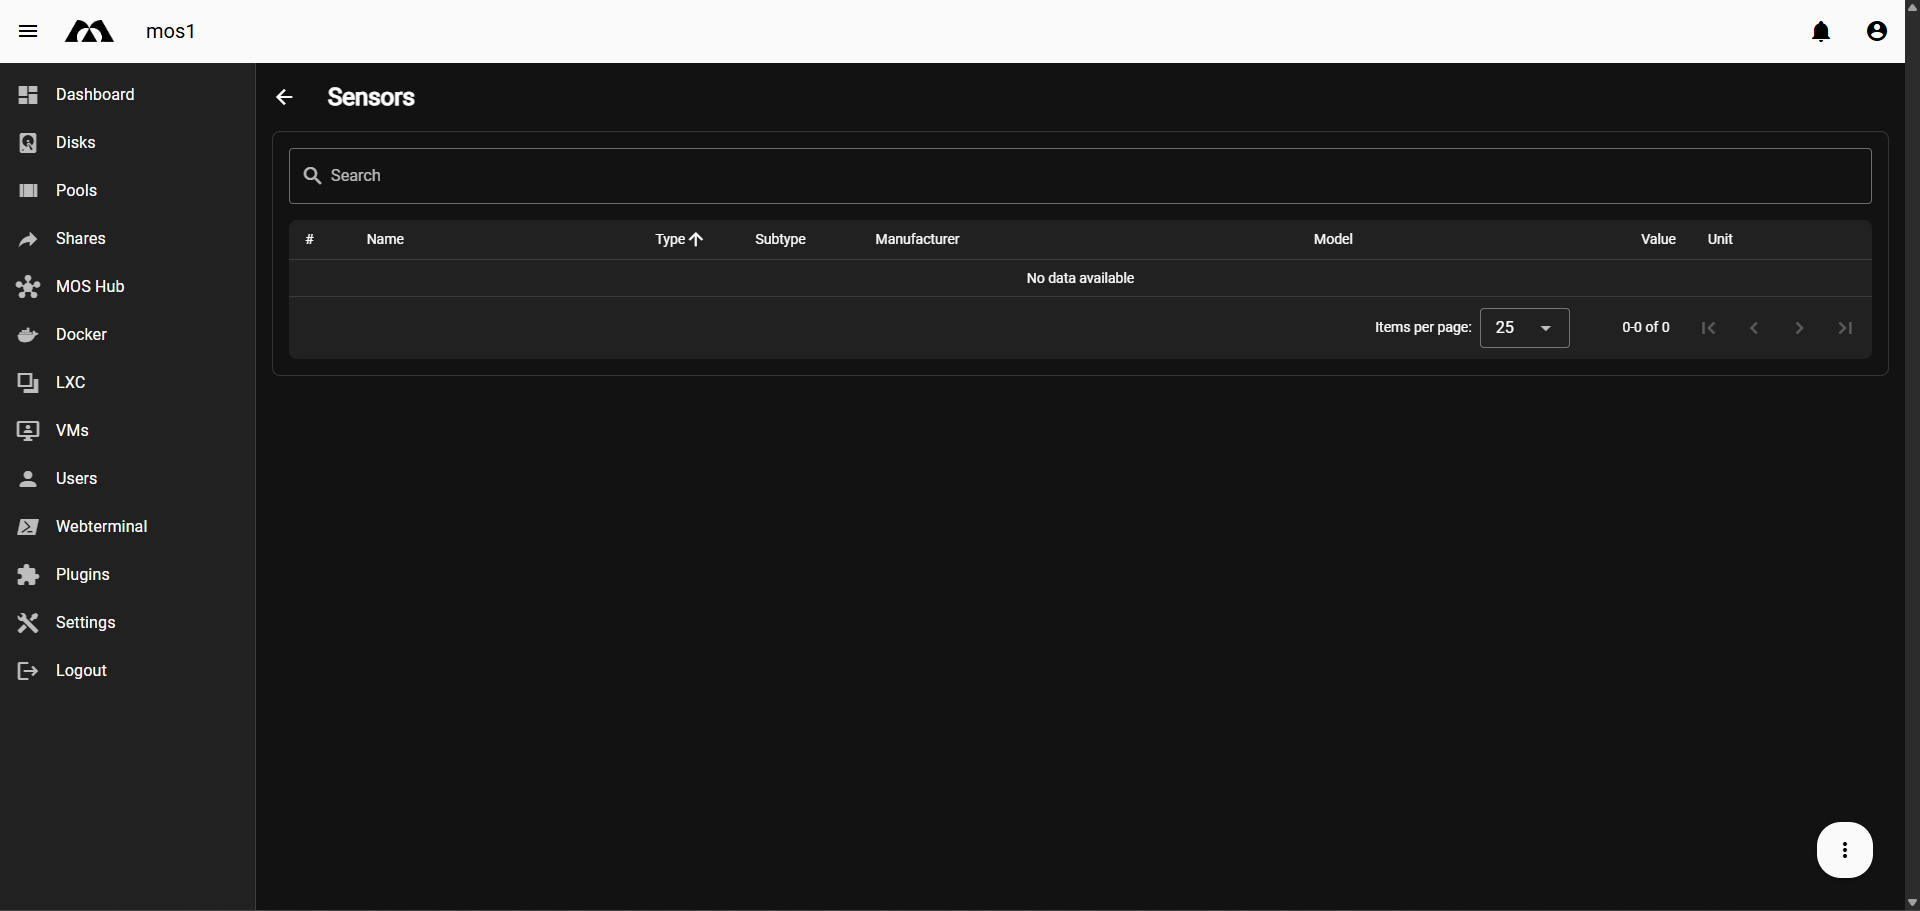
🖥️ Sensors Overview
The Sensors page displays a table with the following columns:
- # – Internal sensor index
- Name – Display name of the sensor
- Type – Sensor category (e.g. temperature, voltage)
- Subtype – Optional classification
- Manufacturer – Hardware manufacturer
- Model – Device or chip model
- Value – Current sensor reading
- Unit – Measurement unit (e.g. °C, V)
If no sensors are configured yet, the table will be empty.
Example:
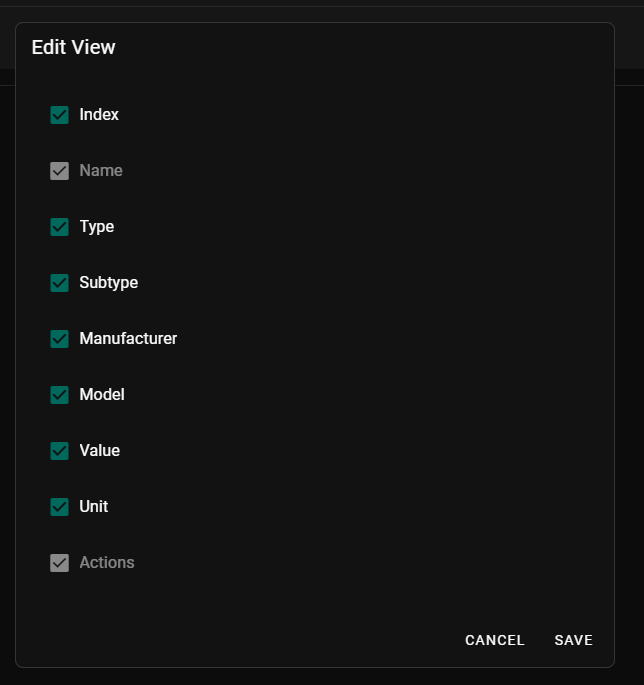
⚙️ View Customization
You can customize which columns are visible in the sensor table.
-
Click the three-dot menu in the bottom-right corner
-
Select Edit View
-
Enable or disable columns as needed
-
Click Save
➕ Creating a Sensor
To create a new sensor:
-
Open Settings → Hardware → Sensors
-
Click the three-dot menu
-
Select Create Sensor
This opens the sensor creation dialog.
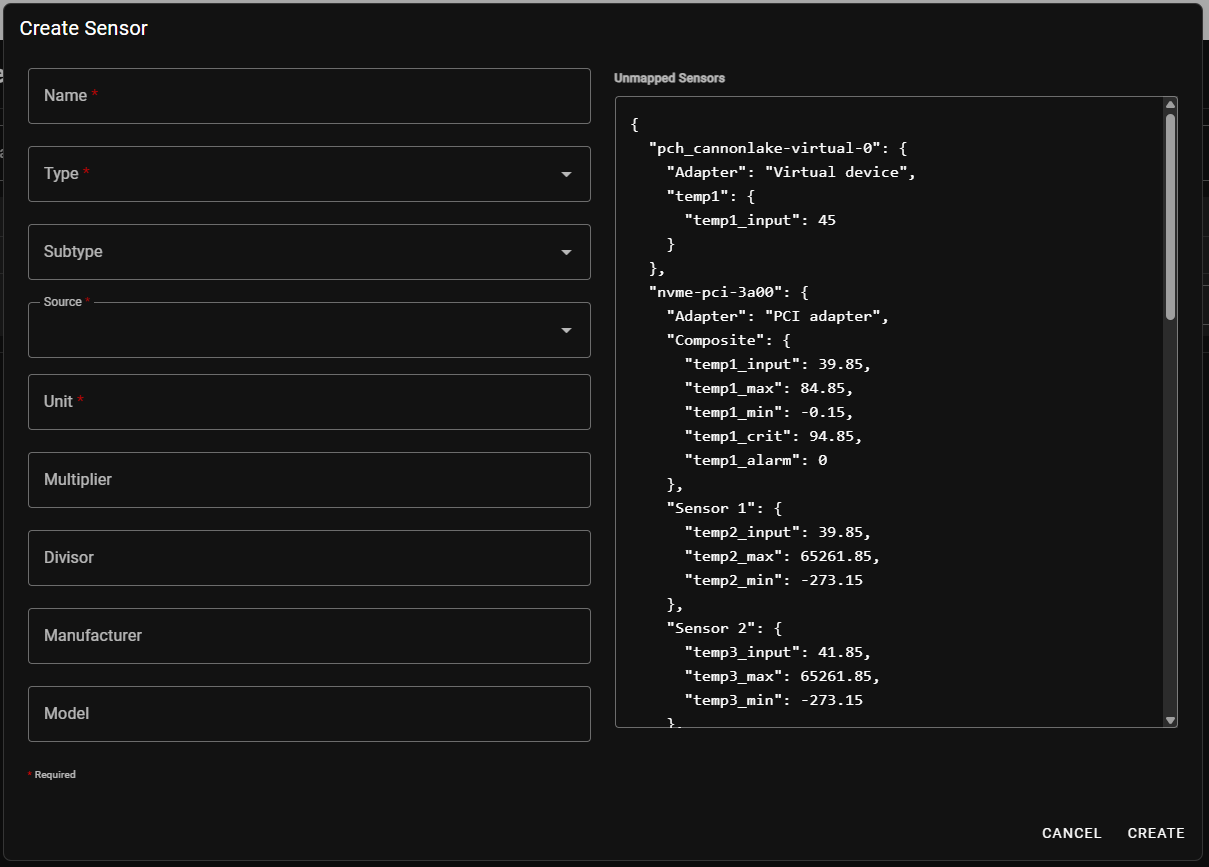
🧩 Create Sensor Fields
Required Fields
-
Name
Human-readable sensor name shown in the UI
-
Type
Sensor type (e.g. Temperature, Voltage, Fan)
-
Source
Raw sensor input source detected by the system
-
Unit
Measurement unit (e.g.
°C,V,RPM)
Optional Fields
-
Subtype
Additional classification
-
Multiplier / Divisor
Used to scale raw values
-
Manufacturer
Hardware vendor
-
Model
Sensor or chip model
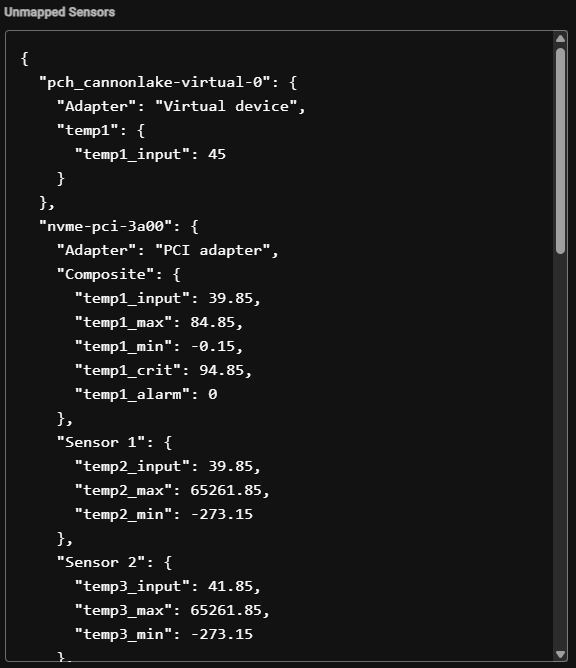
🔎 Unmapped Sensors
On the right side of the Create Sensor dialog, MOS displays Unmapped Sensors.
These are raw sensor values detected on the system but not yet configured. They are typically provided as structured data (e.g. temperatures per CPU core).
You can use this data to select the correct source when creating a sensor.
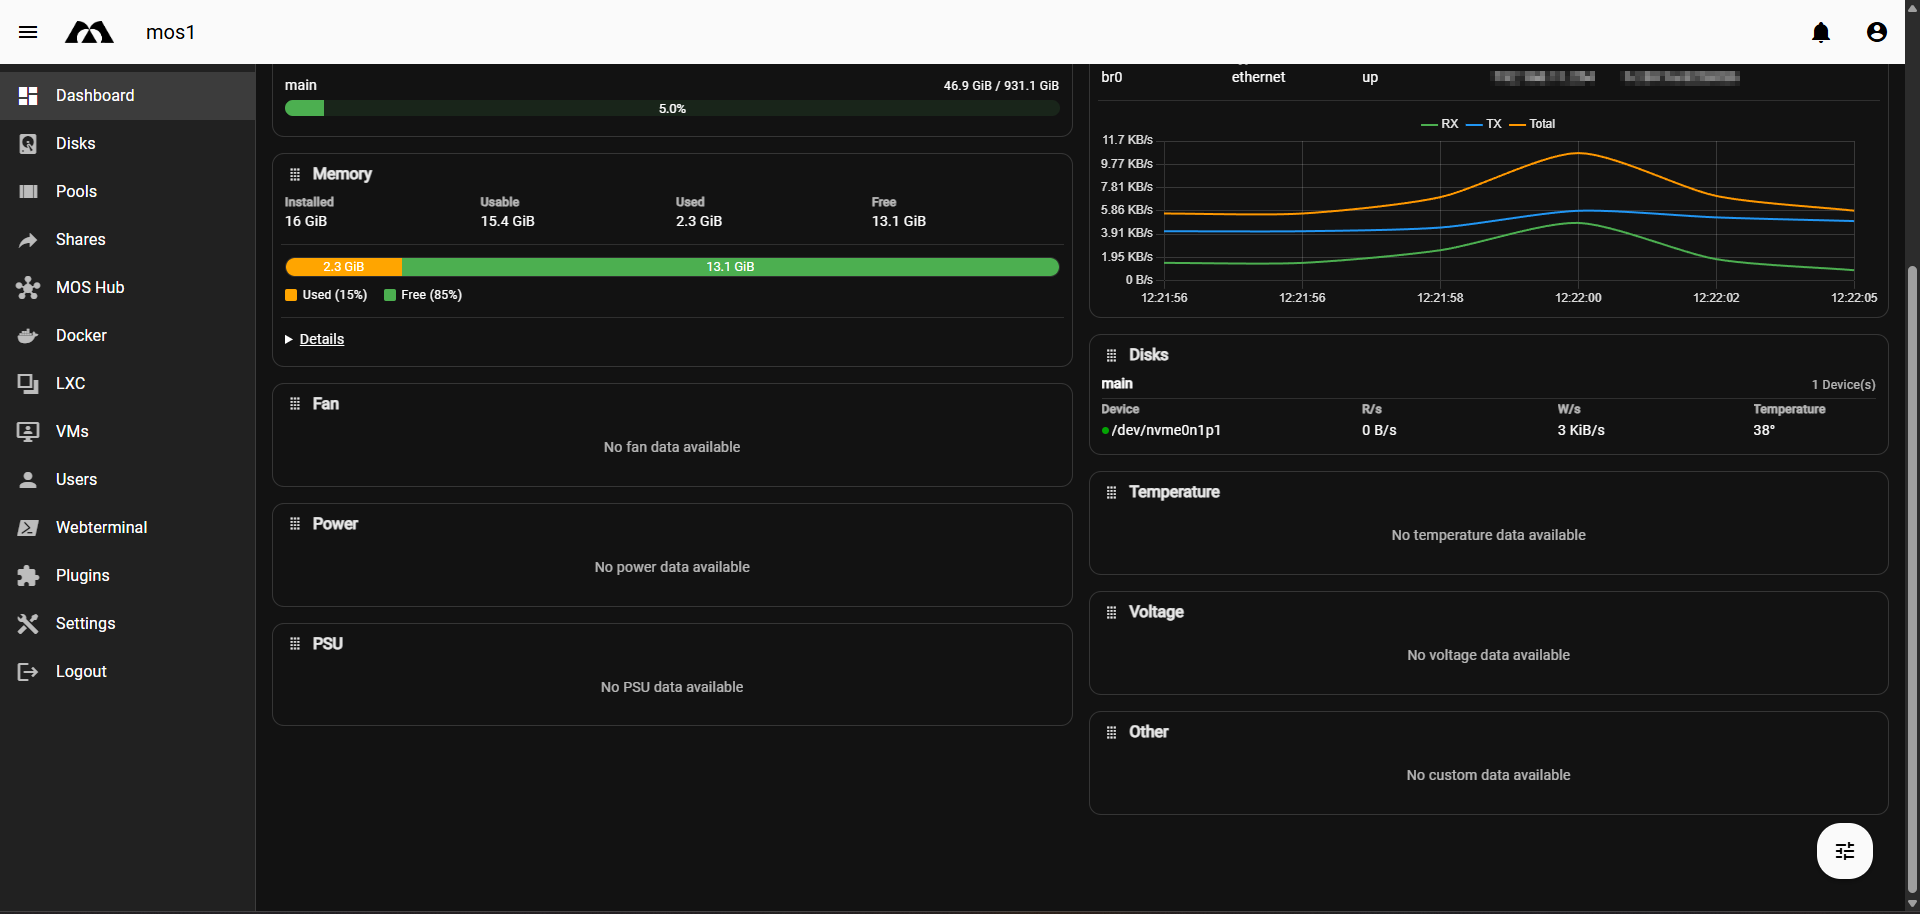
📊 Displaying Sensors on the Dashboard
Once sensors are created, they can be displayed on the Dashboard.
-
Sensors automatically become available as Dashboard widgets
-
Values update in real time
-
Useful for monitoring system health at a glance
Typical dashboard use cases:
-
CPU temperature monitoring
-
Disk temperature tracking
-
Voltage or power readings
-
Custom system metrics
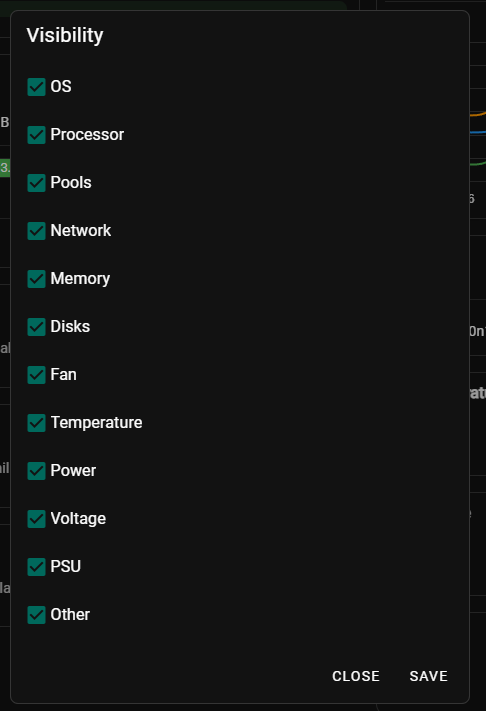
⚙️ Opening the Visibility Settings
- Open the Dashboard
- Click the Dashboard Settings / Filter icon
- Select Visibility
This opens the visibility configuration dialog.
⚠️ Notes & Best Practices
-
Sensor availability depends on hardware and drivers
-
Not all systems expose the same sensor data
-
Use meaningful names for dashboard readability
-
Verify units and scaling (multiplier/divisor) carefully
✅ Summary
-
Sensors provide real-time hardware and system metrics
-
Sensors are managed via Settings → Hardware → Sensors
-
Custom sensors can be created from unmapped system data
-
Configured sensors can be displayed on the Dashboard
Parts of this documentation were created with the assistance of AI tools. All AI-generated content has undergone review, but it may still contain inaccuracies, omissions, or outdated information.